
In this special “Data Edition” of my monthly reporting on security incidents across southern Iraq (Basra, Muthanna, Dhi Qar, Maysan and Wasit), I’ve collated all the data gathered thus far into a single interactive map, pivot table and a number of graphs. Readers can explore and utilise data that captures the previous 6 months (August 2017-January 2018) of security related incidents, ranging from tribal fighting to protest activity. This replaces the monthly data + written analysis report which will return as usual in February.
SIGACT Map: South Iraq August 2017-January 2018
N.B Click the “view larger map” icon, top right, to get full interactivity.
Pivot Table: South Iraq August 2017-January 2018
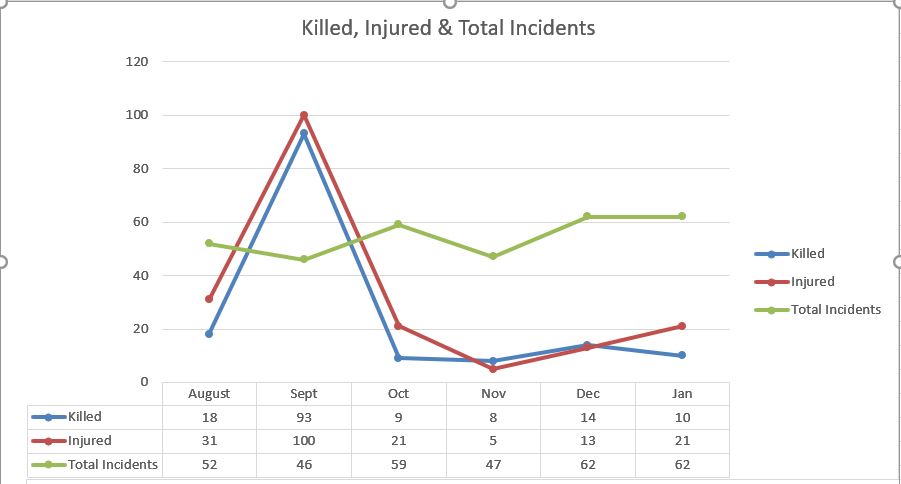
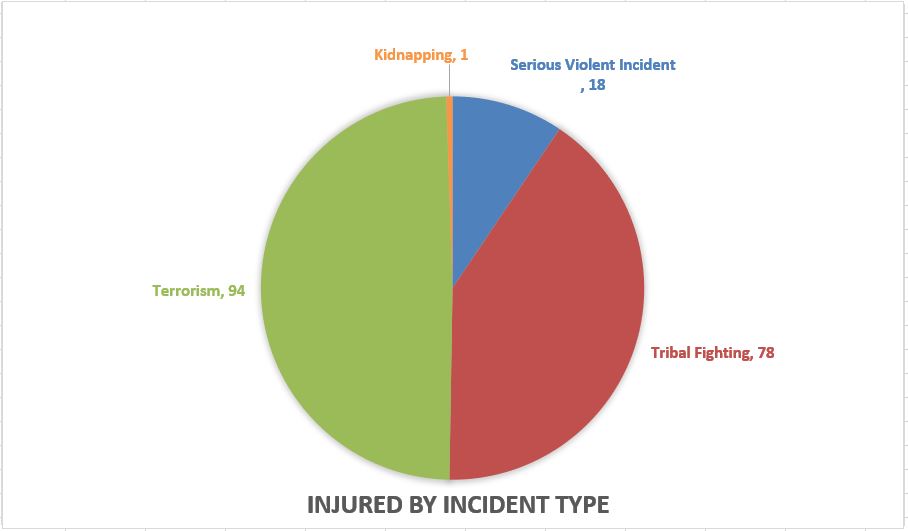
Graphs


Categories: Analysis - تحليل, South Iraq Security Reports
